Economic Analysis
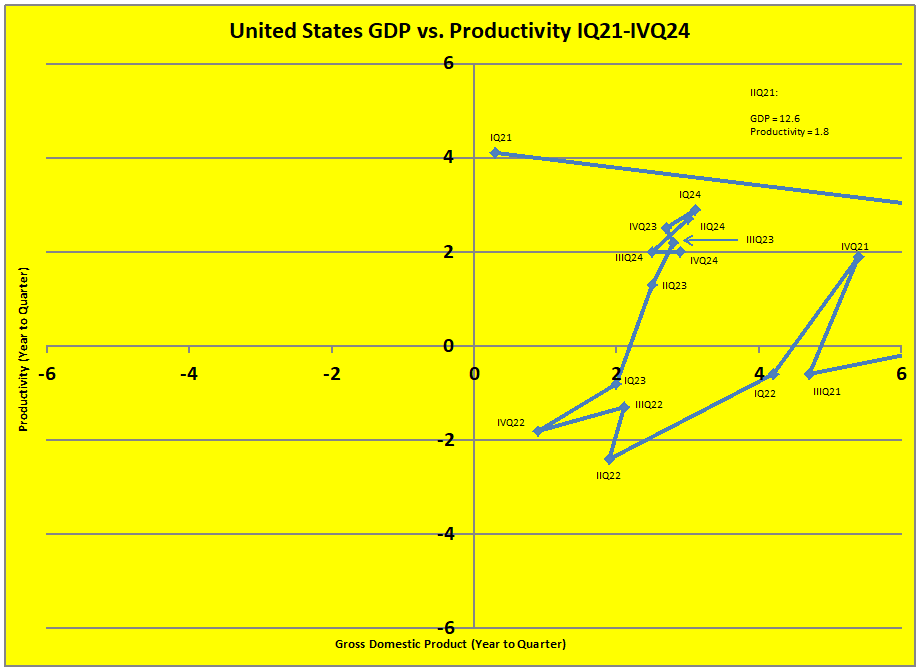
Unless otherwise stated all references to Gross Domestic Product (GDP) or Productivity is based on year to quarter data. For reasons of continuity and comparisons with previous plots, the limits on the present graph has remained the same as before even though the economic decline or accelleration exceeds those limits. This analysis is based on data obtained from reports issued by the United States Bureau of Economic Analysis (BEA) and the Department of Labor Statistics (BLS).
Gross Domestic Product and Productivity
The US economy is running at the top of the typical range for developed nation. In the fourth quarter of 2025, it was 2.10 percent. This is a slight decrease, but remember we are talking about a 31 trillion dollar economy. A small decrease leads to a large dollar value.
At the moment,there are several scenarios. One scenario indicates a situation that can become a serious recession. The new data does not clarify the possibilities. However, a slowdown is posible. Take the possibility seriously.
A personal comment. In the past, the BEA issued a 28 page report. That report has now been redued to five pages. With the old format, the unajdusted data we have used for the last ten years has been the last entry on the last page. We still use BEA data, only now we must calcuate the information ourselves. The conclusion we draw is that the governmnt wants to make it more difficult to judge the state of the economy.
Productivity increase is holding steady between 2-3 percent. Companies, however, are not adding jobs. Some layoffs have occured. Expect a possible downturn in job postings. Rememer it takes 150,000 new jobs per month to keep up with population growth. Anything less than that is a detrioration in the job environment even if the number is positive.
Raymond D. Matkowsky
|